Strumenti Utente
Barra laterale
crescita_del_vocabolario_in_sallustio_e_petronio
La crescita del vocabolario in Sallustio e Petronio
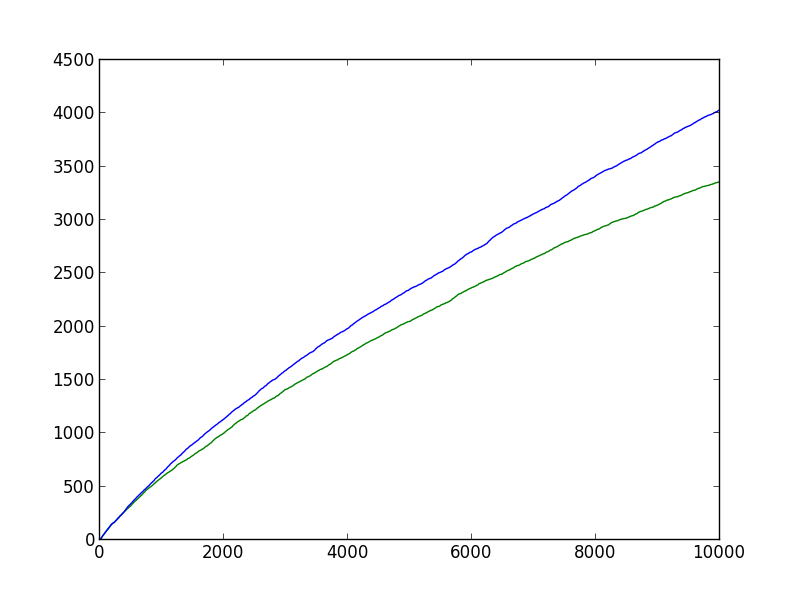
Il codice seguente crea un grafico della crescita del vocabolario nelle prime 10.000 parole del De Catilinae Coniuratione di Gaio Sallustio Crispo (in verde) e di un estratto di 10.000 parole dal Satyricon di Petronio (in blu).
- crescita_vocabolario.py
import matplotlib.pyplot as plt
import xml.etree.ElementTree as ET
xmlfile=ET.parse('testi/ldt-1.5.xml')
root=xmlfile.getroot()

Sallustio=root.findall('.//sentence[@document_id="Perseus:text:2008.01.0002"]//word')
Petronio=root.findall('.//sentence[@document_id="Perseus:text:2007.01.0001"]//word')
testoa=[i.attrib['form'].lower() for i in Sallustio]
testob=[i.attrib['form'].lower() for i in Petronio]
testoa=testoa[:10000]
testob=testob[:10000]
crescitaa=[len(set(testoa[:i+1])) for i in range(10000)]
crescitab=[len(set(testob[:i+1])) for i in range(10000)]
plt.plot(range(1,10001),crescitaa, 'g-')
plt.plot(range(1,10001),crescitab, 'b-')
plt.show()
Dovrebbe prodursi un grafico di questo tipo:

crescita_del_vocabolario_in_sallustio_e_petronio.txt · Ultima modifica: 2021/10/29 21:20 da deleteme
Strumenti Pagina
Ad eccezione da dove è diversamente indicato, il contenuto di questo wiki è soggetto alla seguente licenza: CC Attribution-Share Alike 4.0 International

